
Challenge
A venture capital firm has attracted limited partners by emphasizing a rigorous, analytical approach to evaluating potential investments. Over the years, it has developed methods for quantifying many of the standard elements of its diligence checklist: market size estimates, growth benchmarks, customer acquisition costs, etc. However, it has been unable to quantify the one evaluation dimension the partners consider most valuable — their judgment about a team's ability to execute. While opinions on execution capabilities are drawn from years of experience, they are inherently subjective and often differ — sometimes strongly.
Solution
The first part of the solution was to recognize that quantification requires structure. So, rather than attempting to measure an abstract idea such as "execution capability," a causal map of various drivers was created. Below is a small piece of the result.
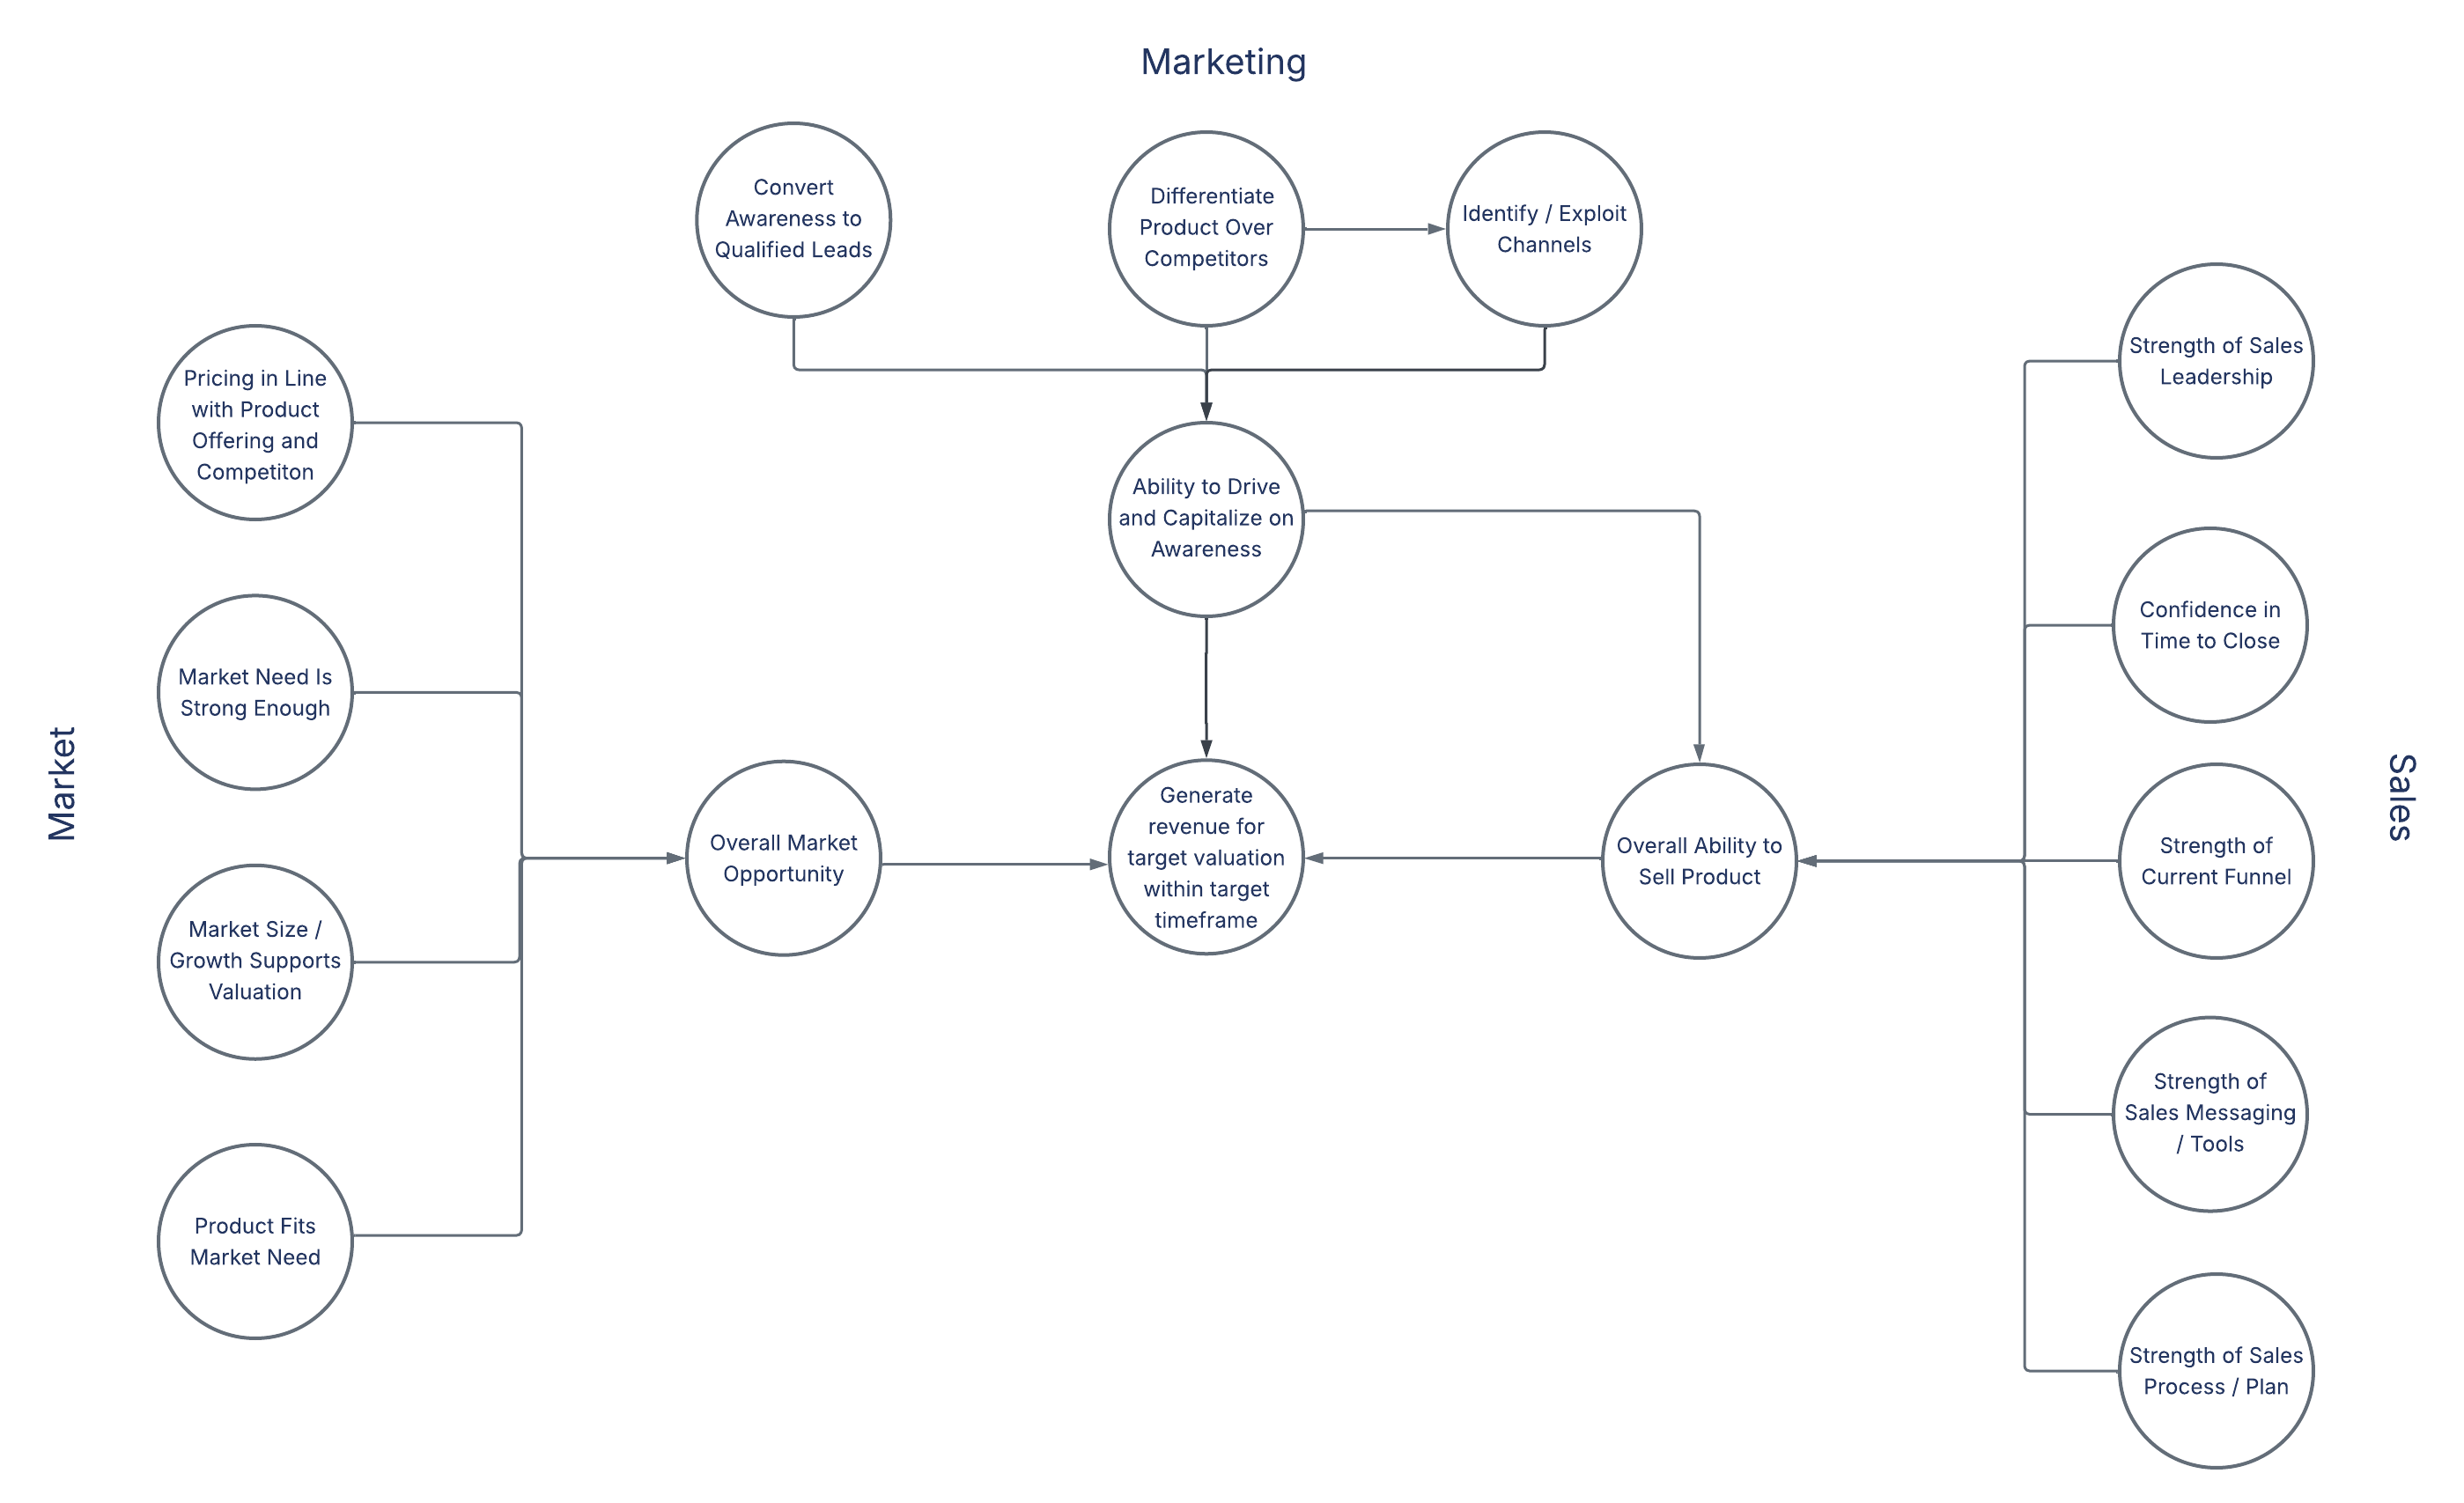
This branch of the map describes Revenue Generation causality. The top grouping consists of Driver nodes that feed into a higher-level Composite node. For example, the Driver node Convert Awareness to Qualified Leads has a causal relationship with Ability to Drive and Capitalize on Awareness. Composite nodes can then, in turn, be treated as Drivers for higher-level outcomes.
Nodes may also participate in more than one causal relationship. For example, Differentiate Product Over Competitors can directly influence Identify / Exploit Channels.
The second part of the solution was to capture judgment about each of the top-level (exogenous) Drivers as well as confidence in that judgment. Each General Partner was asked to estimate the probability that the venture's operating team would be able to execute on the function in each node. For example, they might be asked whether a venture had a 0%, 25%, 50%, 75%, or 100% probability of Converting Awareness to Qualified Leads. Then, they were asked to rank their confidence in their assessment as High, Medium, or Low. The scores for each partner were combined into a single probability distribution. That distribution was, in turn, combined with distributions from other nodes. The process continued until a single probability distribution was produced for the end node.
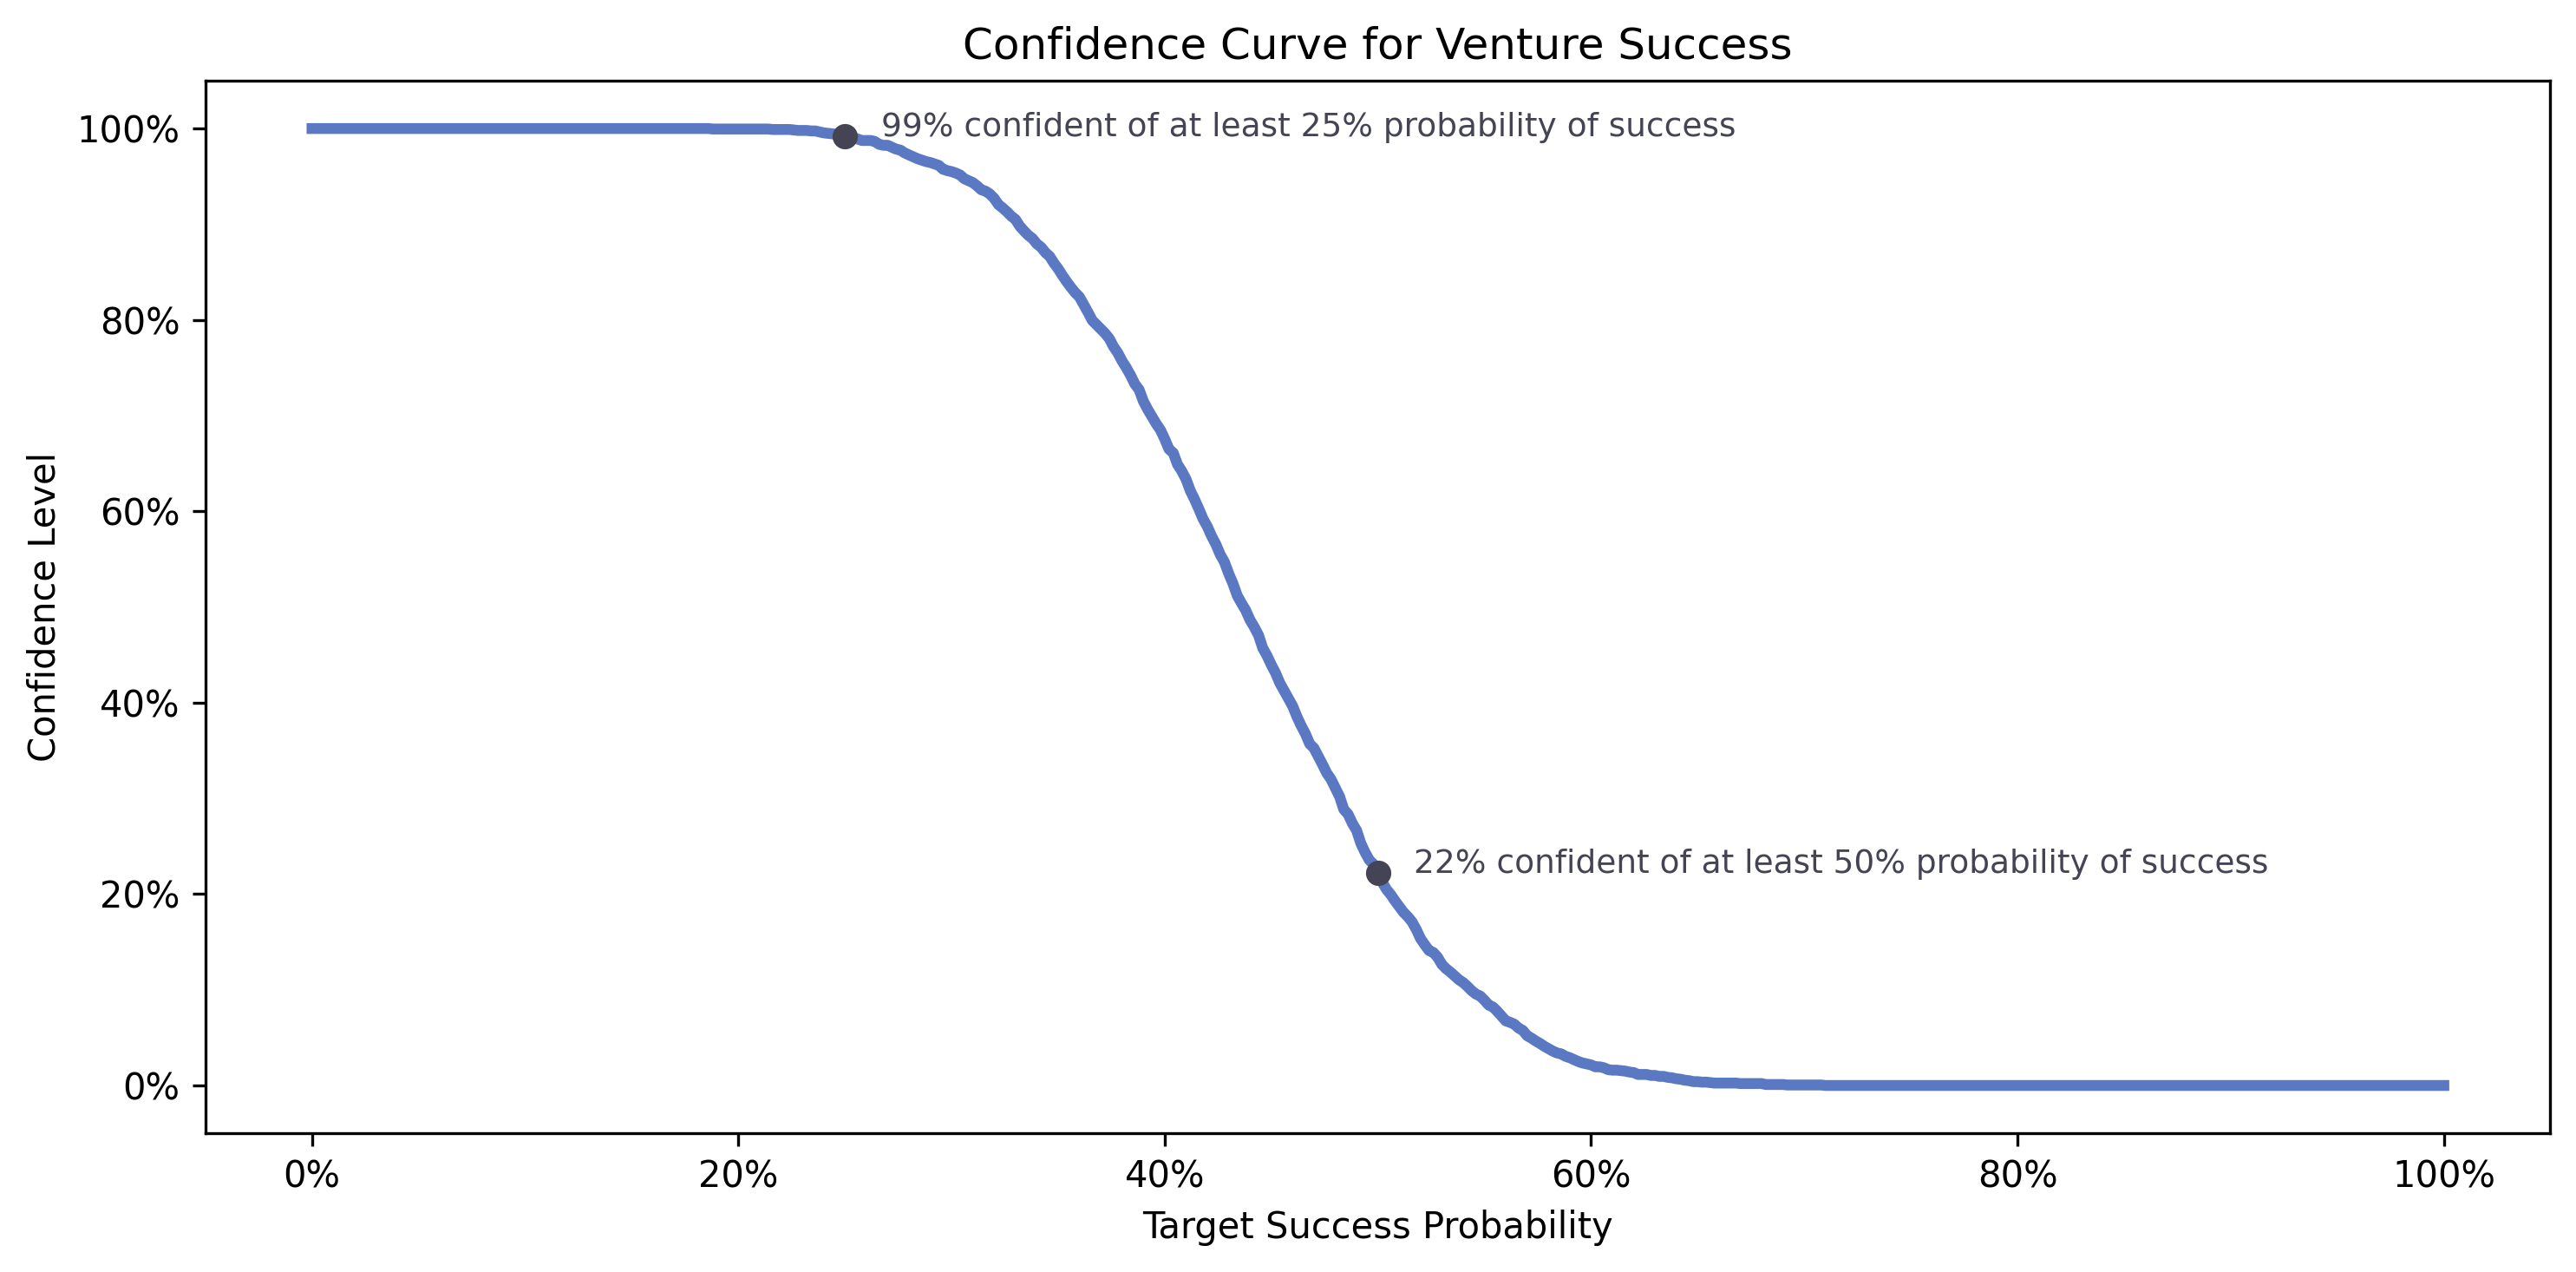
The result is a survival curve that shows the confidence levels for different probabilities of success. For example, the partners could be 99% confident that the venture has at least a 25% probability of succeeding, but only 22% confident of a 50% probability of success.
Displaying each GP's estimated probability distribution for each node allowed the partners to see where they agreed, where they diverged, and how much confidence to place in their consensus. Instead of three competing gut instincts, the firm now had a shared, transparent probability of success that could be discussed, challenged, and refined.
Technical
The most challenging component of this process is combining multiple experts' opinions about the probability of success with their confidence in those opinions. We accomplish this through Bayesian inference using the Python PyMC module. Our model uses a Beta distribution as the conjugate prior for a Binomial likelihood.
Each expert's opinion (a probability and a confidence level) is converted into pseudo-observations of successes and failures. The model then:
- Treats the underlying "true" probability of success as unknown, with only a weak prior.
- Represents each expert's belief as a Beta distribution parameterized by their stated probability, scaled by a numeric confidence level.
- Uses the resulting pseudo-successes and pseudo-trials as the observed data in a Binomial likelihood.
This structure weights opinions by the confidence assigned to them and pools the results into a single posterior distribution of the probability of success. Inputs from the Driver nodes are then combined into a single estimate for each Composite node using a simple linear function. This allows for causal relationships between different exogenous nodes while also weighting their relative importance. We use the same technique to roll up all nodes into a single distribution that describes the probability of success for the startup.
← Back to Writing