
The goal of B2B engagement marketing is to build prospect relationships that survive the decision journey and, of course, positively influence sales. While you, as a B2B marketing professional, can find no end of advice on how to put engagement programs in place, there are few if any sources of information on how to measure success. How, for example, would you measure your ability to maintain prospect engagement over time? Are you really influencing buying decisions? How can you evaluate changes in your engagement marketing methods?
Survival Analysis
The term “Survival Analysis” is one of the rare instances when the name of a statistical technique is actually descriptive. Survival Analysis was originally used to study the outcomes of medical procedures, drug regimens, etc. It was (and is) used to determine the probability of an event over time. And, that “event” was often death – hence the term Survival Analysis.
There are many resources for developing an in-depth understanding of Survival Analysis (see the bottom of the page for a few of them). But, in this article, it is only necessary to understand how to interpret a Survival Curve.
In the medical studies, a Survival Curve will often show the cumulative probability that a patient will have survived to a given time. To use this technique on Prospects, we are going to have to make some modifications.
Prospect Engagement
(If you are interested in implementing this yourself, you can find the code and my thought process in a Jupyter Notebook. The github repository can be found here.)
Let’s start our exploration of our prospect database by looking at the below Survival Curve:
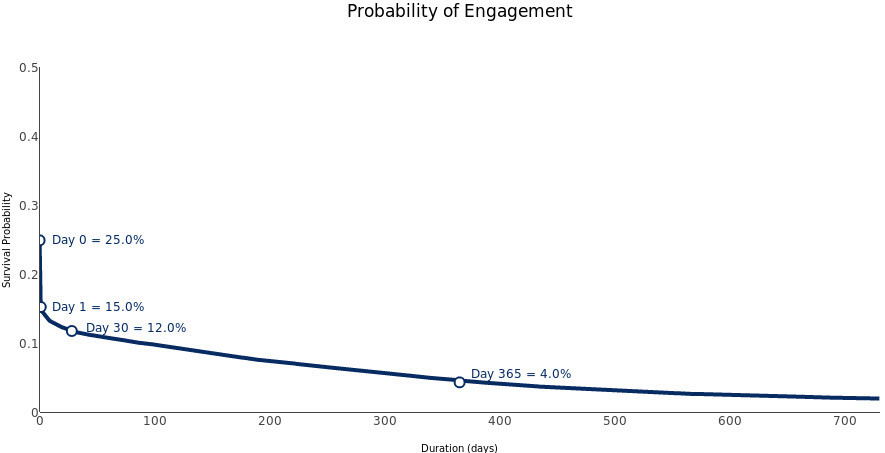
This can be interpreted as saying that a given prospect has a 15% probability of “surviving” past day 1. To make this more relevant to our purposes, we will say that the prospect has a 15% probability of remaining engaged with marketing past day 1, a 12% probability past day 30 and a 4% probability past day 365.
Anyone who is familiar with Survival Analysis will immediately notice something very strange about this curve – it doesn’t start with 100% probability of survival on day 0. In virtually any other circumstance where Survival Analysis will be used, all participants (think medical patients) will arrive at the beginning of the study alive! We wish this were the case with prospects, but we know that many of them (75% here) will be DOA. In other words, they will never engage with us at all. I think it is important to show this. The drop in probability from day 0 to day 1 occurs because around 10% of the prospects who do engage with us will do so only once.
The next thing that is important to note here is that with prospects, we will not directly observe a “death”. Prospects will rarely signal to us that they have decided to stop engaging. For this example, I defined a “death” as having occurred when a specified period of time with no engagement has elapsed. (This is a little more complicated than it sounds so, again, if you are interested, see the notebook for more details.)
Finally, we must decide what “Engagement” means. In this case, a prospect is engaged with us when they participate in a voluntary activity such as downloading a whitepaper, attending a webinar, filling out a form, etc. etc. This definition can be as broad as you would like.
(If you were wondering, the initial probability of engagement in the above chart was higher than was expected in this industry.)
Applying Survival Analysis
Now that we have gotten some of the details out of the way, let’s use Survival Analysis to begin exploring our database.
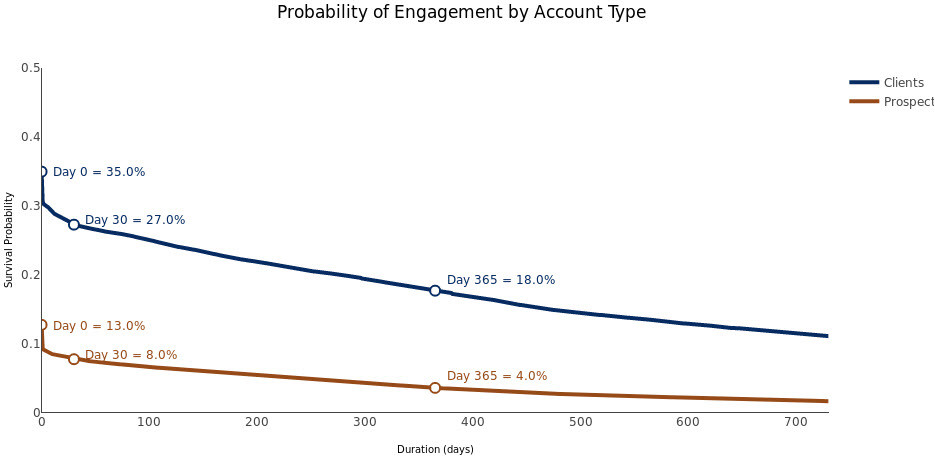
One of the first questions we may want to ask is: Do our engagement efforts make a difference? In the above chart we compare survival curves for those prospects who go on to become clients and those who remain as prospects. We can see from these curves that, as we would expect, those prospects who go on to become clients have a much higher probability of engagement from the outset (35%). And, if anyone challenges us with the explanation that this is simply the result of buyers being more interested from the beginning, we can point to the much higher probability of engagement over time as evidence that our efforts lead to buying activity.
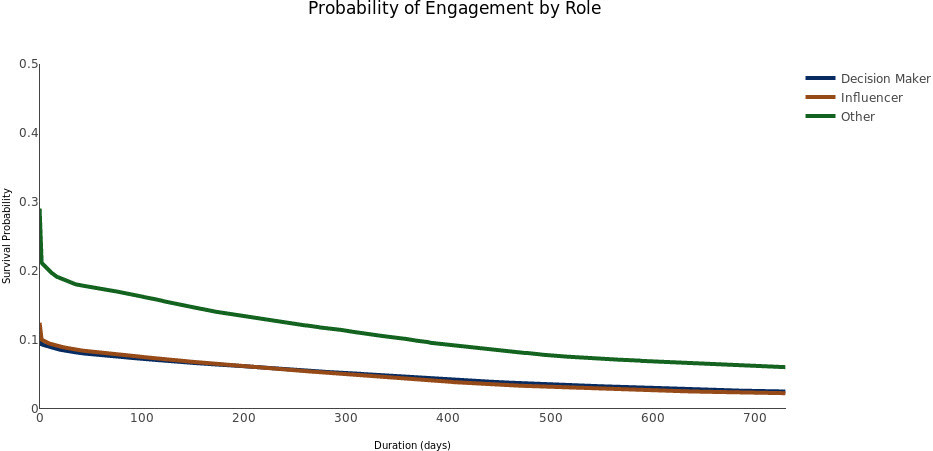
When we compare curves by role, we get disappointing results. It seems that we have roughly double the probability of engaging those prospects who are neither Influencers nor Decision Makers. In fact, the survival curves of Decision Makers and Influencers are indistinguishable from each other. So, either we did a really poor job of defining a “Decision Maker”, etc. or our content seems to appeal more to those outside of the executive suite.
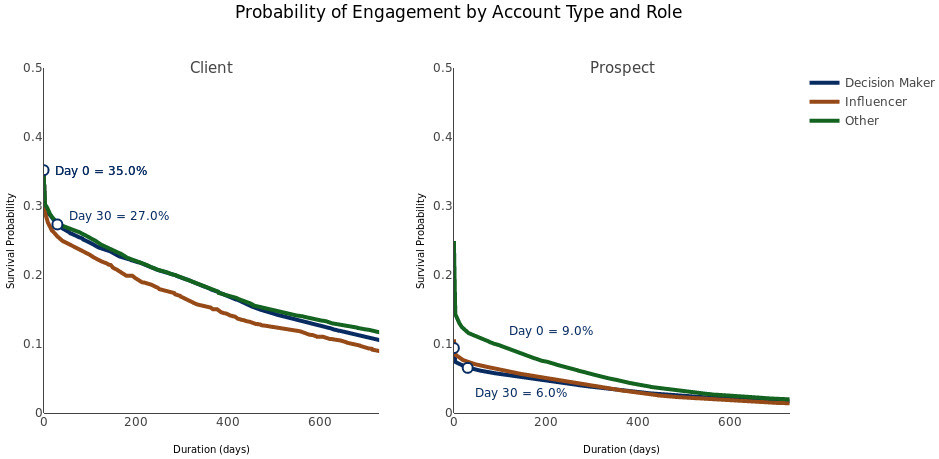
Breaking the same curves out by Account Type, we can clearly see the impact that engaging with Decision Makers has on conversion. A Decision Maker for an account that becomes a client is four times as likely to engage with us. And, the probability of them remaining engaged at the end of 30 days is also four times higher. This seems to negate the idea that we did a poor job of defining “Decision Maker”, and, unfortunately, implies that our content probably needs a few revisions to more consistently appeal to higher level personnel.
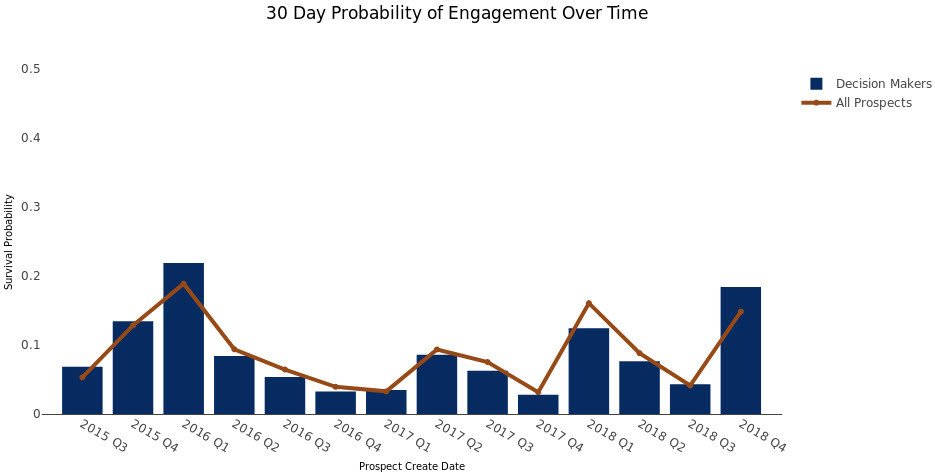
Finally, since our 30 day probability of engagement seems to be a reasonably good proxy for the state of the total curve, we can use it to compare and contrast other features of our database. In the above chart, we take a look at the result of our engagement efforts over time. The x axis represents the quarter that a prospect entered into our database. In this case, the decline in the probability of continuing engagement during 2016 was likely due to some changes in strategy and personnel that occurred during that time period. However, what seems to be a pattern of declining results as each year goes on is a bit of a mystery. Maybe marketing changes its focus in later quarters? Research is ongoing.
Final Thoughts
Hopefully this has been a helpful introduction to Survival Analysis as applied to engagement marketing. Its a relatively simple technique that can be applied to a wide variety of questions:
- Is there an association between survival time and the number of emails that a prospect receives? (i.e. – do too many or too few emails cause them to disengage?)
- Is there a correlation between prospect survival and the source of the prospect? Do some commercial databases, for instance, provide more engaged prospects than others?
- Can we segment prospects based on survival probability? For example, if we know that a non-client Decision Maker has a 6% probability of remaining engaged 30 days after the first interaction with us, would we tailor our messaging accordingly?
Additional Sources
- A great explanation of survival analysis (without the math)
- Nice exploration of survival analysis applied to customer demand
- Using survival analysis to estimate lifetime value
To find out how we can help contact us.